On Tuesday we posted the metric of the month (Fixed Asset Utilization this month). Today we’re going to take it one step further and talk about how Fixed Asset Utilization translates into – or “connects” -- to key performance indicators (KPIs)….in other words, things you can actually talk to your client about impacting through your solutions. Said differently – this is the how to make the numbers make your job easier. Your client has a goal, or you have identified an opportunity, to improve their fixed asset utilization. You must answer these two questions -- how and by how much can your solution help them? Business Process Maps (BPM) are a powerful tool to explain to a client how your solution improves performance. They map a financial metric to the business processes that impact it, the activities that comprise each process, and ultimately those processes’ operational key performance indicators (KPIs). This is a sample of a BPM for fixed asset utilization for industrial manufacturing. This is not a complete mapping but provides powerful insights into how to use a BPM. Your client is focused on increasing fixed asset utilization by better managing the business process Produce Products. This is great news since you sell solutions like scheduling and predictive maintenance that increases capacity utilization (click on the graphic to enlarge it):
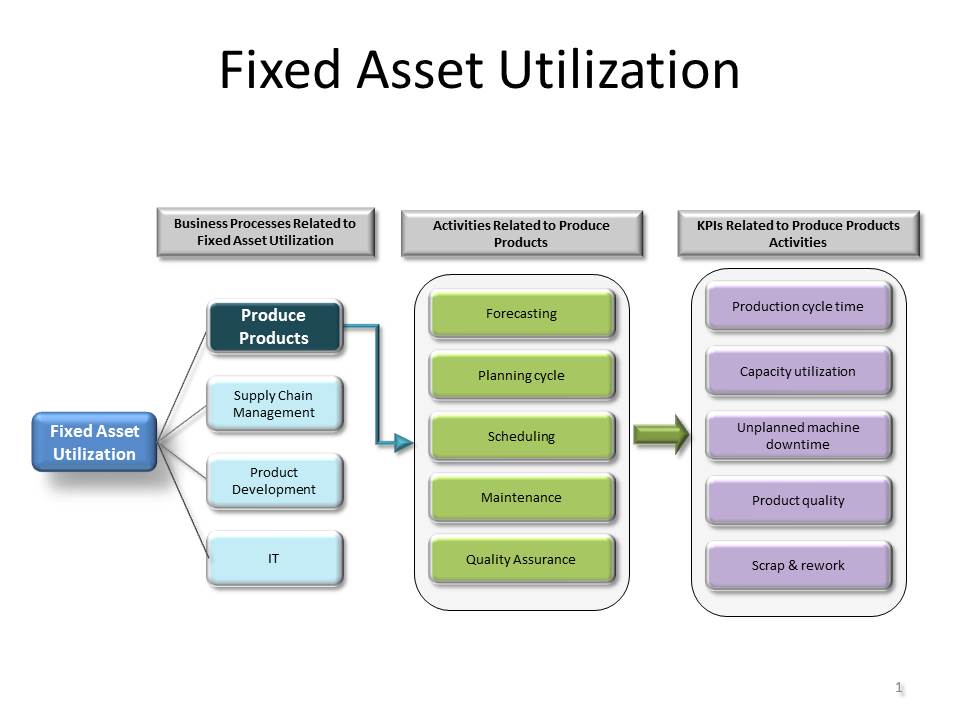
The map connects fixed asset utilization to the business process Produce Products, its related activities like forecasting, scheduling, and maintenance; and the KPI’s like cycle time, capacity utilization, and unplanned machine downtime. So you would explain to your client in business-focused language how your solutions improve capacity utilization and how that will ultimately increase fixed asset utilization.
Operational KPIs In Action Here’s how the how much conversation could go. Your client has $1 billion in annual revenue and $0.250 billion in fixed assets resulting in a fixed asset utilization of 4.00. Maintenance and other expenses related to fixed assets are 20%. Early in the sales process you likely do not know the client’s capacity utilization. It is recommended you start with the industry average to help the client visualize the potential financial benefits and motivate the client to share their specific performance. Research shows the industry average capacity utilization is 85% and the better performers are closer to 90%s. Your experience with other clients in the industry tells you that your solutions can increase capacity utilization by at least 5%. At 5%, holding sales the same, your solution helps the client avoid over $10 million in capital expenditures and $2 million in annual maintenance. Fixed asset utilization would increase to approximately 4.20 from 4.00 and profitability would increase 20 basis points from the reduction in maintenance expense. These are the kind of results that motivate client executives to want to explore your solution further. Not only that, but you can also point out that delaying the decision to implement, or dragging the decision out through a long RFP process, will cost them too – in this example, between $208,000 and $350,000 per month! Compelling stuff…..
The key to getting the above information? Asking questions:
- For your clients’ industries, what metrics, business processes and operational KPIs can your solutions significantly impact?
- What are industry norms for these operational KPIs?
- What ranges of improvement do your solutions provide for these KPIs and what is the cash flow value to your clients?
And of course – the most important question: How can you impact these areas and ultimately drive results for your client’s business? For a deeper discussion on Operational KPIs and how they drive sales, see our previous blog post at http://www.finlistics.com/blog/introducing-a-new-series/
This blog was originally posted on December 18, 2014