 We’re launching a new series on our blog starting next week called the “Metric of the Month”, and along with it a follow-up “KPI Connection” article each week. Our entire business is built around the belief that to be effective selling to executives, you need to be able to speak their language – and that language is rooted in numbers. But how do you take something as flat as a financial metric and “liven it up” into a meaningful conversation with a potential or existing client?
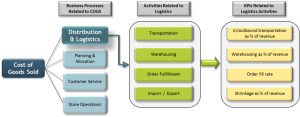
You talk KPIs, of course. What’s that, you ask? We’re so glad you asked (we love this stuff!). Operational key performance indicators (KPIs) are quantifiable metrics that client executives use to manage and measure business performance. We use something we call Business Process Maps to identify the KPIs associated with the various business processes by industry (there’s an example below of one of these showing the Logistics process in the retail industry).
In general, however, looking at the specific components of a business process and measurable areas of impact within each leads you to what the operational KPIs are within each area of your client’s business. They’re important to you as a seller because Operational KPIs help you develop estimates of HOW MUCH financial value your proposed solutions may create. This adds to your solution’s value statement, builds credibility, and often motivates your client to move more quickly. Still not clear? Think of it this way. You have identified your client’s initiatives, discussed how your solutions are aligned with these initiatives and how they deliver business value.
Before exploring your solution further, the client executive wants an indication of how much financial value your solution will deliver. This is where use of operational key performance indicators (KPIs) helps you. For example, if you show that you understand your client is trying to reduce costs and you see an opportunity within the logistics area – but more specifically that your solution can help them lower warehousing and outbound transportation costs by helping them better manage these processes, that hits a direct area of focus for that executive and now you’ve got their attention. Now add numbers to the mix – say your experience with your other retail clients says you can lower their transportation costs by 5% - 10%.
Industry averages show outbound transportation costs in retail are 3.5% of revenue. For a client with $1 billion in revenue, that’s $35 million per year. Even a 5% improvement is $1.75 million in annual savings – and taking it one step further - costs them almost $150,000 every month they delay implementing your solution! Pretty compelling stuff, isn’t it? (you can see why we love it now, right?) So that’s what these monthly postings are all about. We’ll give a snapshot view of a key financial metric –we’ll mix them up by industry to keep it interesting – and then we’ll post on related KPIs to help you translate that metric into dollars and sense when talking to your clients. We’d love your input too. Let us know what you think.
What can we do more of, less of, etc, to make these meaningful and useful. In other words, HOW can we get better and HOW MUCH are they helping you? We’ll kick if off next week with our first in the series – Cost of Goods Sold as a % of Revenue Oh….and here’s that example we promised….don’t worry….we’ll explain it….. This blog was originally posted on November 12, 2013.
