 On Tuesday we posted the metric of the month (Efficiency Ratio this month).
Today we’re going to take it one step further and talk about how the Efficiency Ratio translates into – or “connects” -- to key performance indicators (KPIs)….in other words, things you can actually talk to your client about impacting through your solutions. Said differently – This is the HOW to make the numbers make your job easier.
How do you incorporate it into a meaningful discussion with your client? If your client has expressed a need, or you have identified an opportunity, to reduce (improve) their efficiency ratio, HOW and by HOW MUCH can your solution help them?
Let’s take a look at an example of a tool we use here at FinListics. We call them Business Process Maps and they do just what you think they might do – they map a financial metric to the business processes that impact it, the activities that comprise each process, and ultimately to the KPIs that can be impacted by changes or improvements in that business process. Here we’re looking at a sample of the Business Process Map for the Efficiency Ratio in the banking industry, and are focusing on the breakdown of Sales & Marketing for our example (click on the graphic to enlarge it): 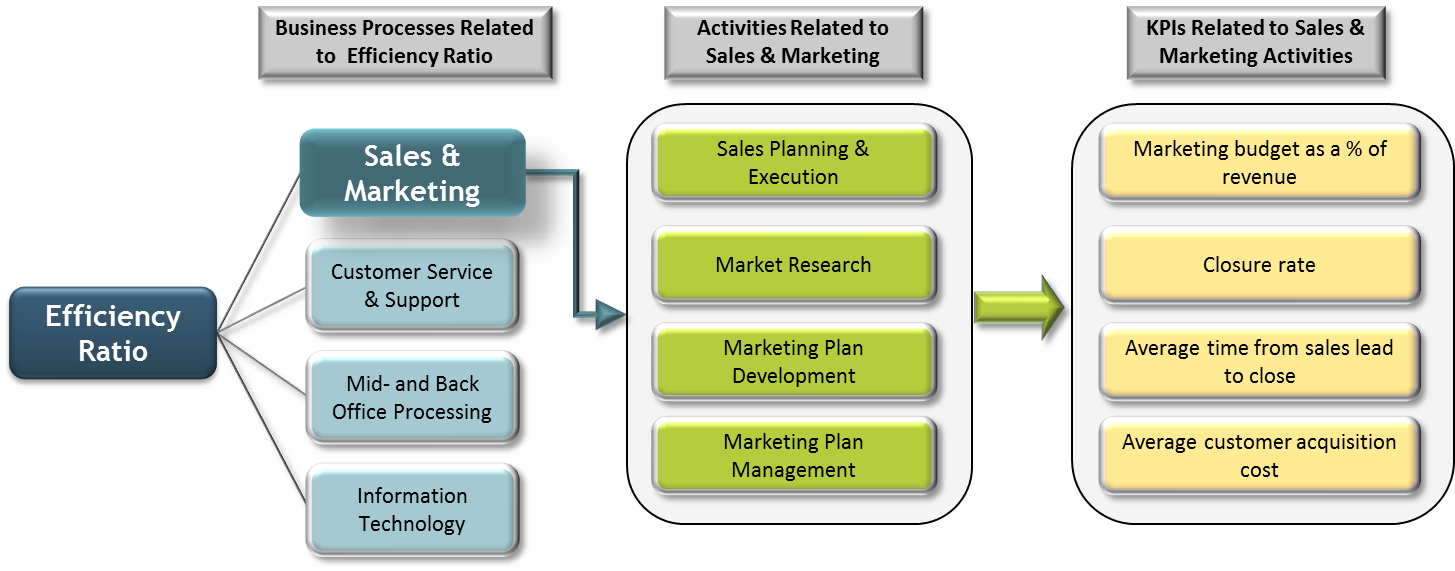 The map connects the Efficiency Ratio to the business process of Sales & Marketing and shows the marketing budget as a % of revenue as one KPI that can be impacted by changes in the underlying sales & marketing activities within a bank.
So when you’re talking to a banking client who’s focused on improving their efficiency ratio, one example of talking the HOW, would be to show how your solutions can reduce marketing costs….and HOW that will ultimately reduce the efficiency ratio.
Operational KPIs In Action
Here’s how that conversation could go -- for a bank with $1 billion in annual revenue, industry averages show that the marketing budget typically is about 6.9% of revenue. Your experience with other banking clients tells you that your solution can reduce those costs by 3%-5% on an annual basis - which means you can save your client $2.1 to $3.5 million per year just in that one area with your solution! That’s the kind of value that gets client executives to sit up and take notice. Not only that, but you can also point out that delaying the decision to implement, or dragging the decision out through a long RFP process, will cost them too – in this example, between $175,000 and $292,000 per month! Compelling stuff…..
The key to getting the above information? Asking questions:
- For your clients’ industries, what metrics, business processes and operational KPIs can your solutions significantly impact?
- What are industry norms for these operational KPIs?
- What ranges of improvement do your solutions provide for these KPIs and what is the cash flow value to your clients?
And of course – the most important question:
How can you impact these areas and ultimately drive results for your client’s business? For a deeper discussion on Operational KPIs and how they drive sales, see our previous blog post at http://www.finlistics.com/blog/introducing-a-new-series/