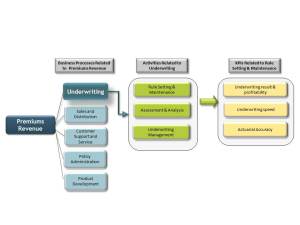
On Wednesday we posted the metric of the month (Loss Reserve). Today we’re going to take it one step further and talk about how the Loss Reserve translates into – or “connects” -- to the Key Performance Indicators (KPIs), for example, Actuarial Accuracy…. In other words, things you can actually talk to your client about impacting through your solutions. Said differently – This is the how… how to make the numbers make your job easier. How do you incorporate it into a meaningful discussion with your client? If your client has expressed a need, or you have identified an opportunity, say, to improve the process of rate making or insurance pricing, how and how much can your solution help them? Let’s take a look at an example of a tool we use here at FinListics. We call them Business Process Maps and they do just what you might think from the name – they map a financial metric to the business processes that impact it, the activities related to each process, and ultimately to the KPIs that can be impacted by changes or improvements in that business process.
Here we’re looking at the business process map for Premiums Revenue in the insurance industry, and are focusing on the breakdown of Underwriting for our example:
The map connects Premiums Revenue to the Underwriting process and shows Actuarial Accuracy as one of the KPI’s that can be impacted by changes in the underwriting processes within a company. How does this connect to the Loss Reserve? Underwriters and actuaries calculate risk and set premiums levels so that the company can have enough money to pay potential claims. Insurers who assess and price their risks accurately, can set aside accurate and adequate loss reserves and therefore are more resilient in facing losses than insurers who do not. So when talking to an insurance client who is focused on pricing , one example of talking the how, would be to show how your solutions can help the client better streamline their underwriting process to improve actuarial accuracy ….and how that can ultimately improve their profitability and stability.
Operational KPIs In Action In the insurance industry, keeping the balance of having enough money to pay potential claims while making a profit is a difficult task. Insurers are constantly recalculating their loss reserves due to new information, new policyholders, new regulations and ongoing renewals of policies. Insurers earn profits from their underwriting operations and from investing premiums in income bearing investments. Underwriting profits are often under pressure due to regulatory limitations and unforeseen risks. The average loss ratio on premiums earned for a Property/Casualty company in the US in 2013 was 67%. So, for an insurance client with $1 billion in annual premiums earned, if your solution can improve the loss ratio by even 1%, that could result in higher profitability. So here’s how you can put the KPI to work -- your experience with other insurance companies shows your solution can improve the loss ratio by 1.0%-2.0% on an annual basis by streamlining their underwriting processes. So, for your insurance client, it means your solution can save your client $10 million – $20 million per year just in that one area with your solution! That’s something every insurer would love to hear.
The key to getting the above information? Asking questions:
- For your clients’ industries, what metrics, business processes and operational KPIs can your solutions significantly impact?
- What are industry norms for these operational KPIs?
- What ranges of improvement do your solutions provide for these KPIs and what is the cash flow value to your clients?
And of course – the most important question: How can you impact these areas and ultimately drive results for your client’s business? For a deeper discussion on Operational KPIs and how they drive sales, see our previous blog post at www.finlistics.com/blog

