March 27, 2014 | Dr. Stephen Timme
On Tuesday we posted the metric of the month (Benefits and Claims as a % of Revenue or Loss Ratio this month). Today we’re going to take it one step further and talk about how the Loss Ratio translates into – or “connects” -- to key performance indicators (KPIs) related to fraud….in other words, things you can actually talk to your client about impacting through your solutions. Said differently – This is the HOW to make the numbers make your job easier. How do you incorporate it into a meaningful discussion with your client? If your client has expressed a need, or you have identified an opportunity, to reduce benefits and claims expenses, HOW and HOW MUCH can your solution help them? Let’s take a look at an example of a tool we use here at FinListics. We call them Business Process Maps and they do just what you might think from the name – they map a financial metric to the business processes that impact it, the activities related to each process, and ultimately to the KPIs that can be impacted by changes or improvements in that business process. Here we’re looking at the Business Process Map for % Benefits and Claims in the insurance industry, and are focusing on the breakdown of Claim Evaluation for our example (click on the graphic to enlarge it): 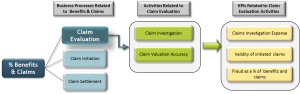 The map connects Benefits and Claims to the Claim Evaluation process and shows fraud as a percentage of benefits and claims as one KPI that can be impacted by changes in the underlying claim evaluation processes within a company. So when you're talking to an insurance client who's focused on reducing benefits and claims as a percentage of revenue, one example of talking the HOW would be to show how your solutions can help the client better detect insurance claim fraud and streamline their claims processing to prevent its occurrence ….and HOW that will ultimately reduce their benefits and claims expenses. Operational KPIs In Action According to industry estimates, insurance fraud accounts for about 10% of the property & casualty insurance industry’s incurred losses. So, for an insurance client with $1 billion in benefits and claims, it means approximately 100 million is lost in fraud per year. So here’s how you can put the KPI to work -- your experience with other insurance companies shows your solution can reduce the value of fraudulent claims by 1.0%-2.0% on an annual basis. For your insurance client, it means your solution can save your client $1.0 million – $2.0 million per year just in that one area with your solution! That’s something every insurer would love to hear. The key to getting the above information? Asking questions:
- For your clients’ industries, what metrics, business processes and operational KPIs can your solutions significantly impact?
- What are industry norms for these operational KPIs?
- What ranges of improvement do your solutions provide for these KPIs and what is the cash flow value to your clients?
And of course – the most important question: How can you impact these areas and ultimately drive results for your client’s business? For a deeper discussion on Operational KPIs and how they drive sales, see our previous blog post at www.finlistics.com/blog
Posted in
Executive Industry Insights,
KPI,
Metric of the Month,
Key Performance Indicator
 The map connects Benefits and Claims to the Claim Evaluation process and shows fraud as a percentage of benefits and claims as one KPI that can be impacted by changes in the underlying claim evaluation processes within a company. So when you're talking to an insurance client who's focused on reducing benefits and claims as a percentage of revenue, one example of talking the HOW would be to show how your solutions can help the client better detect insurance claim fraud and streamline their claims processing to prevent its occurrence ….and HOW that will ultimately reduce their benefits and claims expenses. Operational KPIs In Action According to industry estimates, insurance fraud accounts for about 10% of the property & casualty insurance industry’s incurred losses. So, for an insurance client with $1 billion in benefits and claims, it means approximately 100 million is lost in fraud per year. So here’s how you can put the KPI to work -- your experience with other insurance companies shows your solution can reduce the value of fraudulent claims by 1.0%-2.0% on an annual basis. For your insurance client, it means your solution can save your client $1.0 million – $2.0 million per year just in that one area with your solution! That’s something every insurer would love to hear. The key to getting the above information? Asking questions: